Historical coverage report
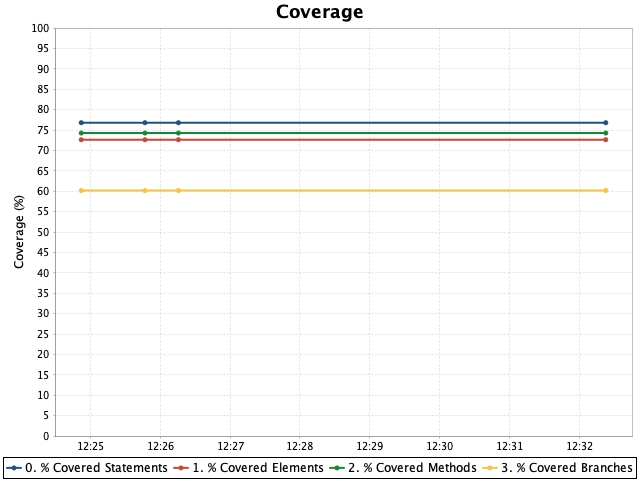
Coverage overview
| Conditionals | Statements | Methods | TOTAL | ||
|---|---|---|---|---|---|
| Project | 60,6% | 77,1% | 73,5% |
|
|
Added classes
Table shows classes which have been added over the last 29 minutes. Actual interval (based on timestamps of history points) is 29 minutes. Showing maximum 5 classes. Metric used: % TOTAL Coverage, max value is 100.
Changed classes
Table shows classes for which metric has changed (increased or decreased) above the threshold (+/-1) over the last 29 minutes. Actual interval (based on timestamps of history points) is 29 minutes. Showing maximum 5 classes. Metric used: % TOTAL Coverage, max value is 100.
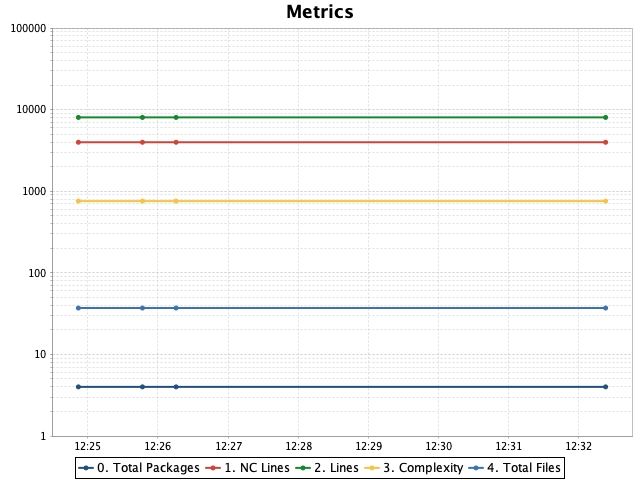
Charts